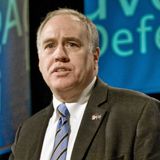
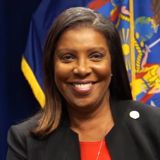
DiNapoli ran 5.4 points ahead of Hochul in Nassau
How each party's down-ballot candidates did compared with their Governor candidate. Blue = Democrat ran ahead of Hochul. Red = Republican ran ahead of Blakeman.


Every contested race, vs. the top of the ticket
Bar = points the Democrat ran ahead of Hochul (blue, right) or the Republican ran ahead of Blakeman (red, left). Center line = Governor result in the same area.
All 4 down-ballot candidates, ranked
Points ahead of (+) or behind (−) their party's Governor candidate. Votes include every party line.
Why down-ballot candidates run ahead of or behind the top of the ticket
Voters can split their ballots, and many do. Gaps between a Governor candidate and the same party's candidates further down the ballot are common in New York. General reasons include:
- Incumbency and name recognition. Long-serving officeholders are often better known than their challengers.
- Different opponents. Every race has its own matchup, and some challengers are stronger or weaker than others.
- Fusion and minor-party lines. Candidates can appear on more than one party line (for example Working Families or Conservative), and the line mix differs from race to race.
- Local issues and campaigns. District races can turn on local issues, spending and outreach that don't affect the Governor's race.
- Roll-off. Some voters skip races further down the ballot, so each race is decided by a slightly different set of voters.
This page only reports what the unofficial numbers show. It does not say why any individual candidate ran ahead or behind.
Where the data runs out
- All numbers are unofficial election-night counts. Absentee, affidavit and military ballots are still to be counted. No races are called.
- Nassau: countywide totals only. Nassau has not published election-district results yet, so only countywide races (State Comptroller and Attorney General) can be compared with the Governor race. District races are left out because the Governor vote inside each district is not yet available.
Method. "Points vs. the ticket" = a candidate's share of the two-party (D+R) vote minus their own party's Governor share (Hochul or Blakeman) countywide. Each candidate's votes are summed across every party line they ran on (Democratic includes Working Families where listed; Republican includes Conservative). In a two-candidate race the Democrat's gap and the Republican's gap are mirror images. "Top" Democrat and Republican = the party's down-ballot candidate with the most votes in this county among those races. Split-ticket EDs compare which party led the Governor race and which led the race shown; EDs with a tie in either are counted separately. Party lines are listed for each candidate in the ranked list; a few candidates also ran on the other major party's usual minor-party ally line (for example a Democrat also on the Conservative line), which can widen their gap.
Source. Nassau County BOE unofficial results (countywide; 1,042 of 1,083 precincts), as of Nov 3, 2026, 11:55:59 PM ET. Unofficial; no races called. Analysis by whorunsny.org.
Photos. Official, campaign and Wikimedia Commons images as listed in our photo sources file; initials shown where we could not confirm a photo. 4 photo sources.